





Method

How we calculate face preferences

The preference map compares the share of portraits you picked from each style with the share of portraits from that style that appeared in your quiz.

See your own preference map
A sample crowd8 FACES
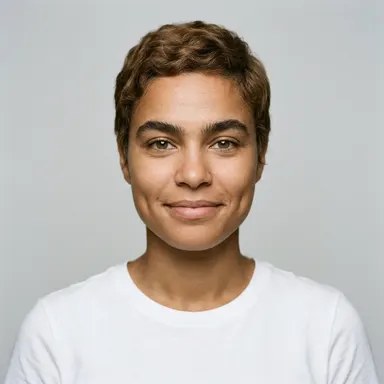
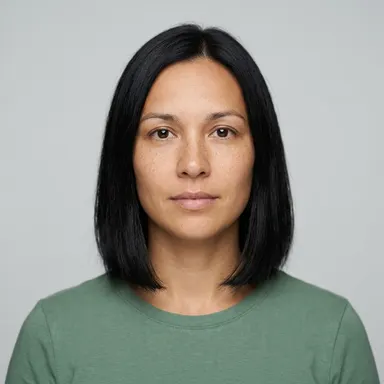
Fictional adult portrait 1Fictional adult portrait 2Fictional adult portrait 3Fictional adult portrait 4Fictional adult portrait 5Fictional adult portrait 6Fictional adult portrait 7Fictional adult portrait 8

An example from the women’s portrait group. The quiz also offers a men’s group.

01

Compare picks with exposure

For each style, the map plots the proportion of your selected portraits against the proportion of portraits you saw. A point above the diagonal represents a style that accounts for a larger share of your picks than of your exposure.

02

Why the diagonal matters

If every style made up the same share of your picks as it did of the portraits shown, the points would fall near the diagonal. The map is a compact description of your session, not a scientific measure of attraction.

03

Treat small samples as a first read

A handful of taps can produce a lopsided map. More choices and more portrait exposure may change the pattern, so the result is best read as a starting point rather than a stable label.

See what catches your eye

Make a few quick choices and let the pattern take shape.

See your own preference map